Abstract
Records on 35-day body weight from two purebred broiler lines A (n=15,010), B (n=14,111), and their crosses C (n=7600) were used to estimate genetic parameters using within-line and terminal-cross models. The models that were fitted included the fixed environmental effect (such as contemporary group and sex, day of hatching), random additive and random parental dominance effects. The model for purebreds included only one additive effect, whereas the model for crossbreds included two additive effects (additive effect for sire in A on his C offspring and additive effect for dam in B on her C offspring). Heritability estimates for 35-day body weight were 0.24, 0.226 and 0.24 with within-line models for lines A, B, and C, respectively, and 0.25, 0.23, and 0.25 with the crossbred model, respectively. The ratio estimates of dominance to phenotypic variance were 0.19, 0.32, and 0.11 with within-line models for lines A, B, and C, respectively, and 0.18, 0.33, and 0.11 with the crossbred model, respectively. The genetic correlations between purebreds and crossbreds for 35-day body weight were 0.65 (A-C) and 0.56 (B-C). Mean reliabilities of predicted purebred breeding values were 0.52 and 0.41 with within-line models for lines A and B, respectively, and 0.58 and 0.46 with the terminal-cross model, respectively. Mean reliabilities of predicted crossbred breeding values were 0.64 and 0.42 with within-line models for lines A and B, respectively, and 0.69 and 0.44 with the terminal-cross model, respectively. Mean reliabilities of predicted breeding values using the crossbred model were increased in comparison with within-line model.
Keywords
Terminal Crossbred Model, Broiler, Genetic Correlation, Reliability
1. Introduction
The goal of commercial poultry breeding programme is to improve crossbred performance. In order to meet this goal, it is required not only to increase the additive effects of purebreds themselves but also to improve the additive effects of animals in purebreds on their corssbred offsprings. In this regrds, many researches showed that the genetic correlation between purebreds and crossbreds is less than 1
| [1] | Duenk, P. et al, Estimating the purebred-crossbred genetic correlation of body weight in broiler chickens with pedigree or genomic relationships. Genet. Sel. Evol. 2019(51), 6-16. |
| [7] | Lutaaya, E. et al, Genetic parameter estimates from joint evaluation of purebreds and crossbreds in swine using the crossbred model. J. Anim. Sci. 2001(79), 3002-3007. |
| [10] | Misztal, I., Besbes, B., Estimates of parental-dominance and full-sib permanent environment variances in laying hens. Anim. Sci. 2000(71), 421-426. |
| [15] | Wei, M., van der Werf, J. H. J., Genetic correlation and heritabilities for purebred and crossbred performance in poultry egg production traits. J. Anim. Sci. 1995(73), 2220-2226. |
[1, 7, 10, 15]
.
For poultry egg production trait, it has been showed that the genetic correlation between purebreds and crossbreds is a function of dominance effects and the difference in gene frequency between parental populations, and its value is decreased with increasing these two factors
| [14] | Wei, M., van der Werf, J. H. J., Maximizing genetic response in crossbreds using both purebred and crossbred information. Anim. Prod. 1994(59), 401-413. |
| [16] | Wei, M., van der Werf, J. H. J, Brascamp, E. W, Relationship between purebred and crossbred parameters. 1. Variances and covariances under the one-locus model. J. Anim. Breed. Genet. 1991a (108), 253-261. |
| [17] | Wei, M., van der Werf, J. H. J., Brascamp, E. W., Relationship between purebred and crossbred parameters ii. genetic correlation between purebred and crossbred performance under the model with two loci. J. Anim. Breed. Genet. 1991b (108), 262-269. |
[14, 16, 17]
.
Wei et al
| [15] | Wei, M., van der Werf, J. H. J., Genetic correlation and heritabilities for purebred and crossbred performance in poultry egg production traits. J. Anim. Sci. 1995(73), 2220-2226. |
[15]
estimated genetic parameters from multivariate model, in which the records from purebreds and crossbreds were treated as separate traits for egg production traits in poultry, and analyzed the interrelation of dominance variance and genetic correlation between purebreds and crossbreds.
Lo et al.
| [5] | Lo, L. L., Fernando, R. L., Cantet, R. J. C, Grossman, M., Theory for modelling means and covariances in a two-breed population with dominance inheritance. Theor. Appl. Genet. 1995(90), 49-62. |
| [6] | Lo, L. L., Fernando, R. L., Grossman, M., Genetic evaluation by BLUP in two-breed terminal crossbreeding systems under dominance. J. Anim. Sci. 1997(75), 2877-2884. |
[5, 6]
proposed the terminal-cross model for joint evaluation of purebreds and crossbreds, which is much simpler in comparison to the model for all types of crossbreds. In this model, there is one additive effect for each pure line and two additive effects for each terminal cross.
Lutaaya et al.
| [8] | Lutaaya, E. et al, Jiont evaluation of purebreds and crossbreds in swine. J. Anim. Sci. 2002 (800, 2263-2266. |
[8]
estimated genetic parameters from joint evaluation model of purebreds and crossbreds taking dominance effects into consideration, and found that accuracy of this method would be high if the number of crossbreds are greater than that of purebreds.
Recently Duenk et al.
| [1] | Duenk, P. et al, Estimating the purebred-crossbred genetic correlation of body weight in broiler chickens with pedigree or genomic relationships. Genet. Sel. Evol. 2019(51), 6-16. |
[1]
calculated the genetic correlations between purebreds and crossbreds performance for body weight in broiler by using the pedigree and genome correlation, respectively, and found that the analysis by genome correlation was better than former. Koerhuis and Thompson
| [4] | Koerhuis, A. N. M., Thompson, R., Models to estimate maternal efects for juvenile body weight in broiler chickens. Genet. Sel. Evol. 1997(29), 225–249. |
[4]
evaluated the maternal effect for juvenile body weight in broiler chickens. Especialy, Mulder et al.
| [12] | Mulder, H. A., Hill, W. G., Vereijken, A., Veerkamp, R. F., Estimation of geneticvariation in residual variance in female and male broiler chickens. Animal. 2009(3), 1673–1680. |
[12]
and Maniatis et al.
| [9] | Maniatis, G., Demiris, N., Kranis, A., Banos G., Kominakis, A., Genetic analysis of sexual dimorphism of body weight in broilers. J. Appl. Genet. 2013(54), 61–70. |
[9]
estimated genetic variance parameters for 35-day body weight.
Motivated by the above cited research, in this paper we are interested in genetic parameter estimates of purebreds and crossbreds for 35-day body weight in broilers using terminal crossbred model. More precisely, the objective of this study is twofold. First, we estimate genetic variance parameters of purebreds and crossbreds for 35-day body weight in broiler by using the terminal crossbred model. This corresponds to the first genetic evaluation by BLUP in Democraic People’s Republic of Korea. Second, we compare the reliabilities of predicted breeding values from within-line and terminal cross models under the condition that the records for crossbreds are smaller than those for purebreds.
2. Materials and Methods
2.1. Data
Data for this study were obtained from the Poultry Acadamy of Sciences, Democratic People's Republic of Korea, and spanned a period of 6yr (From 2018 to 2023). All two lines are Arbor Acres (AA).
Lines A and B are the pure lines used as two-way sire lines for four way crossbreds and line C consists of the crossbreds from lines A and B. Line A is used predominantly as a sire line and line B as a maternal line. After getting rid of the animals with unclear pedigrees and the records greater than three phenotypic SD from the overall means for 35-day body weight, we used the data with 36 721 records.
Table 1 gives the distribution of records by line and sex.
Table 1. Distribution of records by line and sex.
Line | Total (number) | Male (number) | Female (number) |
A | 15 010 | 7568 | 7442 |
B | 14 111 | 6836 | 7275 |
C | 7600 | 3845 | 3755 |
Table 2 shows the mean and standard deviations of 35-day body weight for all lines.
Table 2. Mean and standard deviations of 35-day body weight for all lines.
Line | Mean (g) | Deviation |
A | 1885 | 243 |
B | 1820 | 257 |
C | 1928.5 | 232 |
The purebred lines A, B and the crossbred line C were raised in individual cages under a well-controlled environment. Each sire was mated to approximately 5 to 6 dams in purebred lines and 5 to 8 dams in crossbreds.
2.2. Within-line Analysis
Within-line single-trait analyses were carried out using the following model:
where
is a vector of observations;
is a vector of fixed effects;
is a vector of additive effects;
is a vector of parental dominance effects (
| [3] | Hoeschele, I., VanRaden, P. M., Rapid inversion of dominance relationship matrices for noninbred populations by including sire by dam subclass effects. J. Dairy. Sci. 1991(74), 557-569. |
[3]
);
is a vector of residual effects; and
,
and
are incidence matrices. The vector of fixed effects included contemporary group, sex (male or female) and day of hatching. Variances are:
where is additive relationship matrix, is parental-dominance relationship matrix among individuals, and , and are additive, parental-dominance, and residual variances, respectively.
2.3. Crossbred (Terminal-cross) Model
Combined purebred and crossbred analyses were performed using the following model (
| [6] | Lo, L. L., Fernando, R. L., Grossman, M., Genetic evaluation by BLUP in two-breed terminal crossbreeding systems under dominance. J. Anim. Sci. 1997(75), 2877-2884. |
[6]
):
(2)
where and are vectors of observations for purebred lines A and B, respectively; is a vector of observations for crossbreds (line C); , and are vectors of unknown fixed effects; and are vectors of additive effects of animals in lines A and B, respectively; and are vectors of additive effects of animals in line C originating from lines A and B, respectively; , and are vectors of parental dominance effects; , and are vectors of residual effects; , and are incidence matrices relating records to corresponding effects.
The vector of fixed effects included contemporary group, sex and day of hatching.
The variances are as follows.
where and are additive relationship matrices for lines A and B, respectively; and are additive genetic variances for lines A and B, respectively; and are additive genetic variances for the alleles of line A and line B in crossbreds (line C), respectively; and are genetic covariances between the purebred parents in line and their crossbred (line C) progeny; , where , , are the residual variances for lines A, B, and C; and are the parental dominance relationship matrices for individuals in lines A and B, respectively; are relationship matrix for full-sib family effects in C; , and are one-fourth of the dominance variances for individuals in lines A, B, and C, respectively.
The terminal crossbred model makes it possible to overcome some limitations of the previous models in computation of genetic correlation (see
| [7] | Lutaaya, E. et al, Genetic parameter estimates from joint evaluation of purebreds and crossbreds in swine using the crossbred model. J. Anim. Sci. 2001(79), 3002-3007. |
[7]
). But the model has more parameters to be estimated and needs a larger amount of computational work than the before.
2.4. Computations
In this study, the variances were estimated using Bayesian method via Marcov Chain Monte Carlo (MCMC) Gibbs sampling using the program
asremlPlus, where prior distributions for fixed effects and variances were assumed to be flat for each analysis and initial values for location parameters were set to zero (
| [13] | Sorensen, D., Gianola, D., Likelihood, Bayesian, and MCMC Methods in Quantitative Genetics, Springer-Verlag, New York, 2002. |
[13]
).
Four hundred thousand samples were obtained for each parameter. We carried out the sampling and average of the variance estimations so that their independence and uncorrelation were convinced (
| [12] | Mulder, H. A., Hill, W. G., Vereijken, A., Veerkamp, R. F., Estimation of geneticvariation in residual variance in female and male broiler chickens. Animal. 2009(3), 1673–1680. |
[12]
). We compared the mean reliabilities to find out whether there are some improvements in breeding value estimations. Reliabilities were obtained using the formula:
where
is the reliability for animal i of line j,
is the corresponding prediction error variance, and
is the additive variance for line j (see
| [2] | Henderson, C. R., Applications of linear models in animal breeding. University of Guelph Press, Guelph, Canada, 1984. |
[2]
and
| [11] | Mrode, R. A., Linear models for the prediction of animal breeding values. Wallingford: CABI Publishing. p. 344, 2005. |
[11]
).
3. Results and Discussion
As shown in
Table 1, line A has about 900 more animals than line B and the data of crossbreds is about half as small as purebred lines. Maintenance of purebred was of the main interest and data of observations for pedigreed crossbreds was not much enough.
The number of observations of male for 35-day body weight was 7568 in line A, 6836 in line B, and 3845 in line C, thus line A was the largest, line B was the second, and line C was the smallest. The number of observations of female was 7442 in line A, 7275 in line B, and 3755 in line C.
Means and standard deviations of 35-day body weight of animals were 1885g and 243g in line A, respectively, 1820g and 257g in line B, respectively, and 1928.5g and 232g in line C, respectively. Heterosis proportion by phenotype was explicit. Standard deviation was the largest in line B, and similar in lines A and C.
Though the purelines were raised in individual cages, each generation didn’t have the same effect due to some environment factors.
3.1. Variance Estimates
Within-line variance estimates for 35-day body weight are presented in
Table 3. Additive variances were 8703, 8081, and 10 146 for lines A, B, and C, respectively, one-fourth dominance variances were 1690, 2916, and 1060 for lines A, B, and C, respectively, residual variances were 25 759.79, 24 799.47, 31 233.21, respectively, and phenotypic variances were 36 152.79, 35 796.47, and 42 439.21 for lines A, B, and C, respectively.
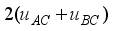
Additive variance of line A was bigger than line B. Additive variance of line C was obtained by
. Variance estimates obtained from the crossbred model are given in
Table 4. Additive variances were 9237, 8699, and 10 872 for lines A, B, and C, respectively, one-fourth dominance variances were 1670, 3058, and 1211 for lines A, B, and C, respectively, residual variances were 26 028, 25 365, and 31 015 for lines A, B, and C, respectively, and phenotypic variances were 36 935, 37 122, and 43 398 for lines A, B, and C, respectively.
Additive variance estimate obtained from the crossbred model was higher than one from the within-line models and dominance variance estimate for line A was lower than line B. Residual variance estimates obtained from within-line analyses were lower than those from the crossbred model for lines A, B and C.
One-fourth dominance variances obtained from the within-line model were estimated as 1690, 2916, and 1060 for lines A, B, and C, respectively, and the one obtained from the crossbred model was slightly higher than those obtained using within-line model for lines A and B. Dominance variance estimates for lines A and B were significantly large, especially it was the largest for line B. This will affect the crossbreeding between the two pure lines.
Wei at al.
| [15] | Wei, M., van der Werf, J. H. J., Genetic correlation and heritabilities for purebred and crossbred performance in poultry egg production traits. J. Anim. Sci. 1995(73), 2220-2226. |
[15]
found that the larger the dominance variation and additive variance difference between purebreds and crossbreds are, the lower the genetic correlation is.
The observation in which dominance variances for both pure lines and additive variance difference between purebreds and crossbreds were large suggests that the gene frequency difference between purebreds and crossbreds is large. Especially, the gene frequency difference between line B and crossbreds seems to be bigger than the difference between line A and crossbreds.
This can be an important factor that results in decrease of the genetic correlation between purebreds and crossbreds. With within-line model, estimates of full-sib family variance for crossbreds were smaller than those for purebred, which may be due to the small number of crossbreds compared to pure lines.
Full-sib family variance estimates obtained using the crossbred model was slightly larger than those obtained from the within-line model. This shows that the more the number of records for crossbreds is, the more accurate the variance estimates are. Moreover, the dominance variance estimates obtained from the crossbred model were larger than those using the within-line model. This suggests that both the dominance variance and gene frequency difference in within line may be decrease at the same time if the generation of animals increases and the performances of purebreds and crossbreds are improved at the same time.
Table 3. Within-line estimates of variances for 35-day body weight.
Line | Additive variance | One-fourth Dominance variance | Residual variance | Phenotypic variance |
A | 8703 | 1690 | 25 759.79 | 36 152.79 |
B | 8081 | 2916 | 24 799.47 | 35 796.47 |
C | 2 (2877+2196) | 1060 | 31 233.21 | 42 439.21 |
Table 4. Estimates of variances for 35-day body weight.
Line | Additive variance | One-fourth Dominance variance | Residual variance | Phenotypic variance |
A | 9237 | 1670 | 26 028 | 36 935 |
B | 8699 | 3058 | 25 365 | 37 122 |
C | 2 (3066+2370) | 1211 | 31 015 | 43 398 |
Table 5. Heritabilities and Genetic Correlations.
Line | Within-Line model | Crossbred model | Genetic Correlation |
Heritability | Ratio of dominance Variances | Heritability | Ratio of dominance variances |
A | 0.24 | 0.19 | 0.25 | 0.18 | 0.68 |
B | 0.226 | 0.32 | 0.23 | 0.33 | 0.62 |
C | 0.24 | 0.11 | 0.25 | 0.11 | |
3.2. Heritabilities and Genetic Correlations
Heritability estimates obtained from within-line and crossbred models, and estimates of genetic correlations between purebreds and crossbreds are given in
Table 5. With within-line model the genetic correlations between purebreds and crossbreds set to 0. Heritability estimates obtained from the crossbred model were slightly higher than those obtained from within-line analyses.
In both models, heritability estimates for line A was the largest, as about 0.24 to 0.25 and heritability estimates for line B was about 0.22 to 0.23, which is similar to those reported in previous literatures
| [1] | Duenk, P. et al, Estimating the purebred-crossbred genetic correlation of body weight in broiler chickens with pedigree or genomic relationships. Genet. Sel. Evol. 2019(51), 6-16. |
| [4] | Koerhuis, A. N. M., Thompson, R., Models to estimate maternal efects for juvenile body weight in broiler chickens. Genet. Sel. Evol. 1997(29), 225–249. |
[1, 4]
. Heritabilty estimates for C was about 0.24 to 0.25.
Crossbreds seemed to be adapted better themselves for environment effects than purebreds. Nevertheless, the residual variance was about 5000 to 6000 and bigger for crossbreds than purebreds. It may be explained by the environment effects and the small of crossbreds compared to purebreds.
Thus, in joint evaluation of purebreds and crossbreds the reliability for crossbreds tends to decrease, so the purebred evaluation may be more suitable. We think that if the number of crossbreds increases and the environment for purebreds and crossbreds is well controlled, then the crossbred heritability estimates may possibly increases.
Although the genetic correlation for line A (0.68) is higher than for line B (0.62), it isn’t as higher as in other literatures
| [1] | Duenk, P. et al, Estimating the purebred-crossbred genetic correlation of body weight in broiler chickens with pedigree or genomic relationships. Genet. Sel. Evol. 2019(51), 6-16. |
| [7] | Lutaaya, E. et al, Genetic parameter estimates from joint evaluation of purebreds and crossbreds in swine using the crossbred model. J. Anim. Sci. 2001(79), 3002-3007. |
[1, 7]
. This was already anticipated but had a certain similarity to the result from Wei et al.
| [15] | Wei, M., van der Werf, J. H. J., Genetic correlation and heritabilities for purebred and crossbred performance in poultry egg production traits. J. Anim. Sci. 1995(73), 2220-2226. |
[15]
.
Hence, it is expected that the genetic correlation may increase when the main purpose of breeding is being the improvement of crossbred performance.
3.3. Reliability
The estimates of mean reliabilities are given in
Tables 6 and 7. Mean reliabilities of predicted purebred breeding values from within-line model was clearly lower than from the crossbred model. For lines A and B, mean reliabilities for the crossbred model were 0.06 and 0.05 higher than those for within-line model, respectively. It may be because we took into account the evaluations of crossbreds as well as purebreds themselves and the genetic correlation between purebreds and crossbreds.
For the within-line model, mean reliabilities of predicted crosbred breeding values were 0.64 for line A and 0.42 for line B. For the terminal-cross model, they were 0.69 and 0.44, respectively.
One can see that mean reliability for line A is much greater than one for line B. The reason may be because line A was used as sire line and line B was used as dam line.
Table 6. Mean Reliability of predicted purebred breeding values.
Model | Line A | Line B |
Within-line | 0.52 | 0.41 |
Crossbred | 0.58 | 0.46 |
Table 7. Mean Reliability of predicted crosbred breeding values.
Model | Line A | Line B |
Within-line | 0.64 | 0.42 |
Crossbred | 0.69 | 0.44 |
4. Conclusion
The use of the crossbred model by means of joint evaluation of purebreds and crossbreds gives us many benefits. Though the amount of data for crossbreds is smaller than one for purebreds, it would be of certain benefit to purebreds used as sire line. It may be of great significance because the affect of sire line is very important in broilers. Thus, when the breeding goals are to improve the proportion of additive effects of animals in crossbred origination from purebred parents and to increase genetic correlation between purebreds and crossbreds, the selection by crossbred model would be more suitable than within-line model.
In the future, we will investigate genetic parameter estimation from genomic data of purebreds and crossbreds for various livestocks using terminal crossbred model.
Abbreviations
BLUP | Best Linear Unbiased Prediction |
SD | Standard Devitation |
Acknowledgments
The authors would like to express their sincere thanks to the editor and the anonymous referees for their valuable comments concerning the paper.
Author Contributions
All authors contributed to the study of this manuscript. All authors read and approve the final manuscript.
Doil Kim: Conceptualization, methodology, writing original draft.
Yongho Kim and Namhyok Ryang: Data curation, software, validation.
Uyon Paek: Writing original draft.
Myonghak Pak: Writing-review-editing.
Gyongsik Jon: Data curation, Investigation.
Aehua Mun: Formal Analysis, Data curation.
Funding
The authors declare that no funds, grants, or other support were received during the preparation of this manuscript.
Conflicts of Interest
The authors declare no conflicts of interest.
References
| [1] |
Duenk, P. et al, Estimating the purebred-crossbred genetic correlation of body weight in broiler chickens with pedigree or genomic relationships. Genet. Sel. Evol. 2019(51), 6-16.
|
| [2] |
Henderson, C. R., Applications of linear models in animal breeding. University of Guelph Press, Guelph, Canada, 1984.
|
| [3] |
Hoeschele, I., VanRaden, P. M., Rapid inversion of dominance relationship matrices for noninbred populations by including sire by dam subclass effects. J. Dairy. Sci. 1991(74), 557-569.
|
| [4] |
Koerhuis, A. N. M., Thompson, R., Models to estimate maternal efects for juvenile body weight in broiler chickens. Genet. Sel. Evol. 1997(29), 225–249.
|
| [5] |
Lo, L. L., Fernando, R. L., Cantet, R. J. C, Grossman, M., Theory for modelling means and covariances in a two-breed population with dominance inheritance. Theor. Appl. Genet. 1995(90), 49-62.
|
| [6] |
Lo, L. L., Fernando, R. L., Grossman, M., Genetic evaluation by BLUP in two-breed terminal crossbreeding systems under dominance. J. Anim. Sci. 1997(75), 2877-2884.
|
| [7] |
Lutaaya, E. et al, Genetic parameter estimates from joint evaluation of purebreds and crossbreds in swine using the crossbred model. J. Anim. Sci. 2001(79), 3002-3007.
|
| [8] |
Lutaaya, E. et al, Jiont evaluation of purebreds and crossbreds in swine. J. Anim. Sci. 2002 (800, 2263-2266.
|
| [9] |
Maniatis, G., Demiris, N., Kranis, A., Banos G., Kominakis, A., Genetic analysis of sexual dimorphism of body weight in broilers. J. Appl. Genet. 2013(54), 61–70.
|
| [10] |
Misztal, I., Besbes, B., Estimates of parental-dominance and full-sib permanent environment variances in laying hens. Anim. Sci. 2000(71), 421-426.
|
| [11] |
Mrode, R. A., Linear models for the prediction of animal breeding values. Wallingford: CABI Publishing. p. 344, 2005.
|
| [12] |
Mulder, H. A., Hill, W. G., Vereijken, A., Veerkamp, R. F., Estimation of geneticvariation in residual variance in female and male broiler chickens. Animal. 2009(3), 1673–1680.
|
| [13] |
Sorensen, D., Gianola, D., Likelihood, Bayesian, and MCMC Methods in Quantitative Genetics, Springer-Verlag, New York, 2002.
|
| [14] |
Wei, M., van der Werf, J. H. J., Maximizing genetic response in crossbreds using both purebred and crossbred information. Anim. Prod. 1994(59), 401-413.
|
| [15] |
Wei, M., van der Werf, J. H. J., Genetic correlation and heritabilities for purebred and crossbred performance in poultry egg production traits. J. Anim. Sci. 1995(73), 2220-2226.
|
| [16] |
Wei, M., van der Werf, J. H. J, Brascamp, E. W, Relationship between purebred and crossbred parameters. 1. Variances and covariances under the one-locus model. J. Anim. Breed. Genet. 1991a (108), 253-261.
|
| [17] |
Wei, M., van der Werf, J. H. J., Brascamp, E. W., Relationship between purebred and crossbred parameters ii. genetic correlation between purebred and crossbred performance under the model with two loci. J. Anim. Breed. Genet. 1991b (108), 262-269.
|
Cite This Article
-
APA Style
Kim, D., Jon, G., Kim, Y., Mun, A., Ryang, N., et al. (2025). Genetic Parameter Estimates of Purebreds and Crossbreds for 35-day Body Weight in Broilers Using Terminal Crossbred Model. International Journal of Animal Science and Technology, 9(3), 149-154. https://doi.org/10.11648/j.ijast.20250903.13
 Copy
|
Copy
|
 Download
ACS Style
Kim, D.; Jon, G.; Kim, Y.; Mun, A.; Ryang, N., et al. Genetic Parameter Estimates of Purebreds and Crossbreds for 35-day Body Weight in Broilers Using Terminal Crossbred Model. Int. J. Anim. Sci. Technol. 2025, 9(3), 149-154. doi: 10.11648/j.ijast.20250903.13
Copy
|
Download
AMA Style
Kim D, Jon G, Kim Y, Mun A, Ryang N, et al. Genetic Parameter Estimates of Purebreds and Crossbreds for 35-day Body Weight in Broilers Using Terminal Crossbred Model. Int J Anim Sci Technol. 2025;9(3):149-154. doi: 10.11648/j.ijast.20250903.13
Copy
|
Download
-
@article{10.11648/j.ijast.20250903.13,
  author = {Doil Kim and Gyongsik Jon and Yongho Kim and Aehua Mun and Namhyok Ryang and Uyon Paek and Myonghak Pak},
  title = {Genetic Parameter Estimates of Purebreds and Crossbreds for 35-day Body Weight in Broilers Using Terminal Crossbred Model
},
  journal = {International Journal of Animal Science and Technology},
  volume = {9},
  number = {3},
  pages = {149-154},
  doi = {10.11648/j.ijast.20250903.13},
  url = {https://doi.org/10.11648/j.ijast.20250903.13},
  eprint = {https://article.sciencepublishinggroup.com/pdf/10.11648.j.ijast.20250903.13},
  abstract = {Records on 35-day body weight from two purebred broiler lines A (n=15,010), B (n=14,111), and their crosses C (n=7600) were used to estimate genetic parameters using within-line and terminal-cross models. The models that were fitted included the fixed environmental effect (such as contemporary group and sex, day of hatching), random additive and random parental dominance effects. The model for purebreds included only one additive effect, whereas the model for crossbreds included two additive effects (additive effect for sire in A on his C offspring and additive effect for dam in B on her C offspring). Heritability estimates for 35-day body weight were 0.24, 0.226 and 0.24 with within-line models for lines A, B, and C, respectively, and 0.25, 0.23, and 0.25 with the crossbred model, respectively. The ratio estimates of dominance to phenotypic variance were 0.19, 0.32, and 0.11 with within-line models for lines A, B, and C, respectively, and 0.18, 0.33, and 0.11 with the crossbred model, respectively. The genetic correlations between purebreds and crossbreds for 35-day body weight were 0.65 (A-C) and 0.56 (B-C). Mean reliabilities of predicted purebred breeding values were 0.52 and 0.41 with within-line models for lines A and B, respectively, and 0.58 and 0.46 with the terminal-cross model, respectively. Mean reliabilities of predicted crossbred breeding values were 0.64 and 0.42 with within-line models for lines A and B, respectively, and 0.69 and 0.44 with the terminal-cross model, respectively. Mean reliabilities of predicted breeding values using the crossbred model were increased in comparison with within-line model.},
 year = {2025}
}
Copy
|
Download
-
TY  - JOUR
T1  - Genetic Parameter Estimates of Purebreds and Crossbreds for 35-day Body Weight in Broilers Using Terminal Crossbred Model

AU  - Doil Kim
AU  - Gyongsik Jon
AU  - Yongho Kim
AU  - Aehua Mun
AU  - Namhyok Ryang
AU  - Uyon Paek
AU  - Myonghak Pak
Y1  - 2025/07/28
PY  - 2025
N1  - https://doi.org/10.11648/j.ijast.20250903.13
DO  - 10.11648/j.ijast.20250903.13
T2  - International Journal of Animal Science and Technology
JF  - International Journal of Animal Science and Technology
JO  - International Journal of Animal Science and Technology
SP  - 149
EP  - 154
PB  - Science Publishing Group
SN  - 2640-1312
UR  - https://doi.org/10.11648/j.ijast.20250903.13
AB  - Records on 35-day body weight from two purebred broiler lines A (n=15,010), B (n=14,111), and their crosses C (n=7600) were used to estimate genetic parameters using within-line and terminal-cross models. The models that were fitted included the fixed environmental effect (such as contemporary group and sex, day of hatching), random additive and random parental dominance effects. The model for purebreds included only one additive effect, whereas the model for crossbreds included two additive effects (additive effect for sire in A on his C offspring and additive effect for dam in B on her C offspring). Heritability estimates for 35-day body weight were 0.24, 0.226 and 0.24 with within-line models for lines A, B, and C, respectively, and 0.25, 0.23, and 0.25 with the crossbred model, respectively. The ratio estimates of dominance to phenotypic variance were 0.19, 0.32, and 0.11 with within-line models for lines A, B, and C, respectively, and 0.18, 0.33, and 0.11 with the crossbred model, respectively. The genetic correlations between purebreds and crossbreds for 35-day body weight were 0.65 (A-C) and 0.56 (B-C). Mean reliabilities of predicted purebred breeding values were 0.52 and 0.41 with within-line models for lines A and B, respectively, and 0.58 and 0.46 with the terminal-cross model, respectively. Mean reliabilities of predicted crossbred breeding values were 0.64 and 0.42 with within-line models for lines A and B, respectively, and 0.69 and 0.44 with the terminal-cross model, respectively. Mean reliabilities of predicted breeding values using the crossbred model were increased in comparison with within-line model.
VL  - 9
IS  - 3
ER  -
Copy
|
Download